Code
library(tidyverse)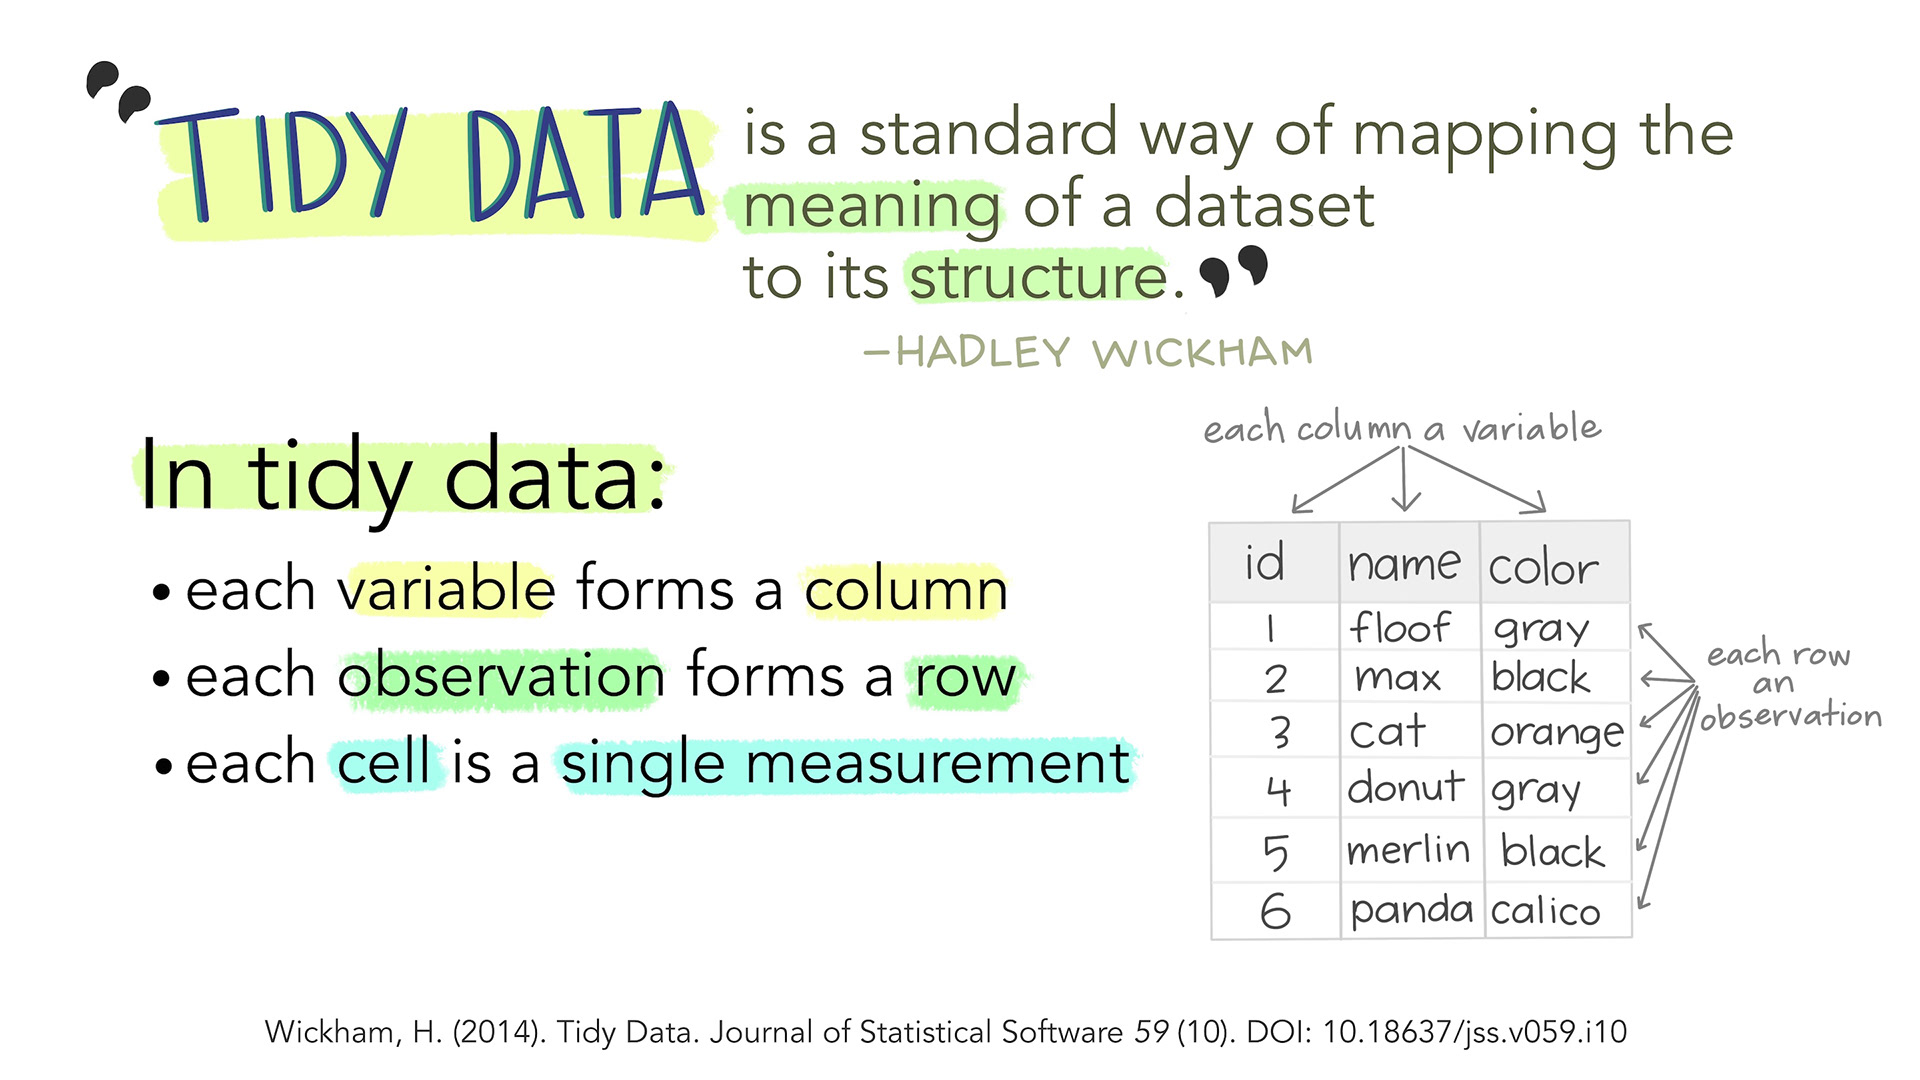
You know the drill. Someone hands you a spreadsheet with columns like cases_2019, cases_2020, cases_2021, values crammed into single cells, and mysterious NAs scattered everywhere. Before you can analyze anything, you need to clean it. This is where tidyr and stringr come in — and where most of your time as a data analyst actually goes.
This tutorial builds directly on Basics of dplyr. If you’re comfortable with filter(), mutate(), and the pipe, you’re ready.
library(tidyverse)We’ll use two built-in datasets throughout this post:
who2 — World Health Organization tuberculosis data (comes with tidyr). Wide, messy, and realistic.starwars — Character data from the Star Wars films (comes with dplyr). Has strings to clean and list-columns to untangle.who2# A tibble: 7,240 × 58
country year sp_m_014 sp_m_1524 sp_m_2534 sp_m_3544 sp_m_4554 sp_m_5564
<chr> <dbl> <dbl> <dbl> <dbl> <dbl> <dbl> <dbl>
1 Afghanistan 1980 NA NA NA NA NA NA
2 Afghanistan 1981 NA NA NA NA NA NA
3 Afghanistan 1982 NA NA NA NA NA NA
4 Afghanistan 1983 NA NA NA NA NA NA
5 Afghanistan 1984 NA NA NA NA NA NA
6 Afghanistan 1985 NA NA NA NA NA NA
7 Afghanistan 1986 NA NA NA NA NA NA
8 Afghanistan 1987 NA NA NA NA NA NA
9 Afghanistan 1988 NA NA NA NA NA NA
10 Afghanistan 1989 NA NA NA NA NA NA
# ℹ 7,230 more rows
# ℹ 50 more variables: sp_m_65 <dbl>, sp_f_014 <dbl>, sp_f_1524 <dbl>,
# sp_f_2534 <dbl>, sp_f_3544 <dbl>, sp_f_4554 <dbl>, sp_f_5564 <dbl>,
# sp_f_65 <dbl>, sn_m_014 <dbl>, sn_m_1524 <dbl>, sn_m_2534 <dbl>,
# sn_m_3544 <dbl>, sn_m_4554 <dbl>, sn_m_5564 <dbl>, sn_m_65 <dbl>,
# sn_f_014 <dbl>, sn_f_1524 <dbl>, sn_f_2534 <dbl>, sn_f_3544 <dbl>,
# sn_f_4554 <dbl>, sn_f_5564 <dbl>, sn_f_65 <dbl>, ep_m_014 <dbl>, …starwars |> select(name, height, mass, skin_color, homeworld)# A tibble: 87 × 5
name height mass skin_color homeworld
<chr> <int> <dbl> <chr> <chr>
1 Luke Skywalker 172 77 fair Tatooine
2 C-3PO 167 75 gold Tatooine
3 R2-D2 96 32 white, blue Naboo
4 Darth Vader 202 136 white Tatooine
5 Leia Organa 150 49 light Alderaan
6 Owen Lars 178 120 light Tatooine
7 Beru Whitesun Lars 165 75 light Tatooine
8 R5-D4 97 32 white, red Tatooine
9 Biggs Darklighter 183 84 light Tatooine
10 Obi-Wan Kenobi 182 77 fair Stewjon
# ℹ 77 more rowsThe most common mess you’ll run into is data that’s wide when it should be long. The who2 dataset is a textbook example — it has separate columns for every combination of diagnosis method, sex, and age group.
who2 |> colnames() |> head(20) [1] "country" "year" "sp_m_014" "sp_m_1524" "sp_m_2534" "sp_m_3544"
[7] "sp_m_4554" "sp_m_5564" "sp_m_65" "sp_f_014" "sp_f_1524" "sp_f_2534"
[13] "sp_f_3544" "sp_f_4554" "sp_f_5564" "sp_f_65" "sn_m_014" "sn_m_1524"
[19] "sn_m_2534" "sn_m_3544"Each of those sp_m_014, sp_f_1524 columns encodes three variables in a single column name. That’s not tidy. Let’s pivot.
who_long <- who2 |>
  pivot_longer(
    cols = !c(country, year),
    names_to = "category",
    values_to = "count",
    values_drop_na = TRUE
  )

who_long
# A tibble: 76,046 × 4
country year category count
<chr> <dbl> <chr> <dbl>
1 Afghanistan 1997 sp_m_014 0
2 Afghanistan 1997 sp_m_1524 10
3 Afghanistan 1997 sp_m_2534 6
4 Afghanistan 1997 sp_m_3544 3
5 Afghanistan 1997 sp_m_4554 5
6 Afghanistan 1997 sp_m_5564 2
7 Afghanistan 1997 sp_m_65 0
8 Afghanistan 1997 sp_f_014 5
9 Afghanistan 1997 sp_f_1524 38
10 Afghanistan 1997 sp_f_2534 36
# ℹ 76,036 more rowsThe values_drop_na = TRUE argument quietly drops all the rows where count is NA. Without it, you’d end up with thousands of empty rows — a common gotcha that balloons your data for no reason.
Those category values still pack three pieces of information into one string. We can split them during the pivot itself.
who_tidy <- who2 |>
  pivot_longer(
    cols = !c(country, year),
    names_to = c("diagnosis", "sex", "age_group"),
    names_sep = "_",
    values_to = "count",
    values_drop_na = TRUE
  )

who_tidy
# A tibble: 76,046 × 6
country year diagnosis sex age_group count
<chr> <dbl> <chr> <chr> <chr> <dbl>
1 Afghanistan 1997 sp m 014 0
2 Afghanistan 1997 sp m 1524 10
3 Afghanistan 1997 sp m 2534 6
4 Afghanistan 1997 sp m 3544 3
5 Afghanistan 1997 sp m 4554 5
6 Afghanistan 1997 sp m 5564 2
7 Afghanistan 1997 sp m 65 0
8 Afghanistan 1997 sp f 014 5
9 Afghanistan 1997 sp f 1524 38
10 Afghanistan 1997 sp f 2534 36
# ℹ 76,036 more rowsOne call and we went from a 56-column mess to a clean, long-format table with clearly named variables. That’s the power of pivot_longer().
Sometimes you need the opposite — spreading long data into a wider format for summary tables or specific analyses. Let’s say we want a quick comparison table of total TB cases by diagnosis method and sex.
who_tidy |>
  group_by(diagnosis, sex) |>
  summarize(total = sum(count), .groups = "drop") |>
  pivot_wider(
    names_from = sex,
    values_from = total
  )
# A tibble: 4 × 3
diagnosis f m
<chr> <dbl> <dbl>
1 ep 941880 1044299
2 rel 1201596 2018976
3 sn 2439139 3840388
4 sp 11324409 20586831pivot_wider() is the inverse of pivot_longer(). You’ll reach for it less often, but it’s essential for creating cross-tabulations and reporting tables.
Sometimes a single column contains multiple values separated by a delimiter. Let’s manufacture a quick example to see separate_wider_delim() in action.
messy_locations <- tibble(
  id = 1:4,
  location = c("USA-New York", "CAN-Toronto", "GBR-London", "AUS-Sydney")
)

messy_locations |>
  separate_wider_delim(
    location,
    delim = "-",
    names = c("country_code", "city")
  )
# A tibble: 4 × 3
id country_code city
<int> <chr> <chr>
1 1 USA New York
2 2 CAN Toronto
3 3 GBR London
4 4 AUS Sydney This cleanly splits one column into two. If the number of pieces isn’t consistent across rows, use too_few and too_many to control the behavior:
tricky <- tibble(
  id = 1:3,
  value = c("A-B-C", "D-E", "F-G-H-I")
)

tricky |>
  separate_wider_delim(
    value,
    delim = "-",
    names = c("first", "second", "third"),
    too_few = "align_start",
    too_many = "merge"
  )
# A tibble: 3 × 4
id first second third
<int> <chr> <chr> <chr>
1 1 A B C
2 2 D E <NA>
3 3 F G H-I The too_few = "align_start" fills missing pieces with NA from the right. The too_many = "merge" lumps extra pieces into the last column. This keeps your pipeline from crashing on messy, inconsistent data.
unite() is the reverse — gluing columns together.
who_tidy |>
  unite("demographic", sex, age_group, sep = "_") |>
  select(country, year, diagnosis, demographic, count) |>
  head()
# A tibble: 6 × 5
country year diagnosis demographic count
<chr> <dbl> <chr> <chr> <dbl>
1 Afghanistan 1997 sp m_014 0
2 Afghanistan 1997 sp m_1524 10
3 Afghanistan 1997 sp m_2534 6
4 Afghanistan 1997 sp m_3544 3
5 Afghanistan 1997 sp m_4554 5
6 Afghanistan 1997 sp m_5564 2This is handy when you need to create an interaction label for plotting or joining.
Real-world data is full of inconsistent text. The stringr package gives you a consistent set of functions (all starting with str_) for detecting, extracting, and replacing patterns.
str_detect() returns TRUE or FALSE, making it perfect inside filter().
# Which Star Wars characters have "Skywalker" in their name?
starwars |>
  filter(str_detect(name, "Skywalker"))
# A tibble: 3 × 14
name height mass hair_color skin_color eye_color birth_year sex gender
<chr> <int> <dbl> <chr> <chr> <chr> <dbl> <chr> <chr>
1 Luke Sky… 172 77 blond fair blue 19 male mascu…
2 Anakin S… 188 84 blond fair blue 41.9 male mascu…
3 Shmi Sky… 163 NA black fair brown 72 fema… femin…
# ℹ 5 more variables: homeworld <chr>, species <chr>, films <list>,
# vehicles <list>, starships <list># Find characters with multiple skin colors (contain a comma)
starwars |>
filter(str_detect(skin_color, ",")) |>
select(name, skin_color)# A tibble: 14 × 2
name skin_color
<chr> <chr>
1 R2-D2 white, blue
2 R5-D4 white, red
3 Jabba Desilijic Tiure green-tan, brown
4 Watto blue, grey
5 Sebulba grey, red
6 Ratts Tyerel grey, blue
7 Dud Bolt blue, grey
8 Gasgano white, blue
9 Ben Quadinaros grey, green, yellow
10 Zam Wesell fair, green, yellow
11 R4-P17 silver, red
12 Wat Tambor green, grey
13 Shaak Ti red, blue, white
14 Grievous brown, white str_replace() swaps the first match; str_replace_all() swaps every match. This is essential for cleaning up inconsistent labels.
starwars |>
  mutate(skin_color = str_replace_all(skin_color, ", ", "/")) |>
  filter(str_detect(skin_color, "/")) |>
  select(name, skin_color)
# A tibble: 14 × 2
name skin_color
<chr> <chr>
1 R2-D2 white/blue
2 R5-D4 white/red
3 Jabba Desilijic Tiure green-tan/brown
4 Watto blue/grey
5 Sebulba grey/red
6 Ratts Tyerel grey/blue
7 Dud Bolt blue/grey
8 Gasgano white/blue
9 Ben Quadinaros grey/green/yellow
10 Zam Wesell fair/green/yellow
11 R4-P17 silver/red
12 Wat Tambor green/grey
13 Shaak Ti red/blue/white
14 Grievous brown/white A common use case: standardizing messy category labels.
raw_labels <- c("United States", "united states", "US", "U.S.", "usa")

raw_labels |>
  str_to_lower() |>
  str_replace_all(c(
    "^us$"      = "united states",
    "^u\\.s\\.$" = "united states",
    "^usa$"      = "united states"
  ))
[1] "united states" "united states" "united states" "united states"
[5] "united states"str_extract() grabs the first matching portion of a string. Let’s pull the numeric age boundaries from our cleaned WHO data.
who_tidy |>
  mutate(
    age_start = str_extract(age_group, "^\\d+") |> as.integer()
  ) |>
  distinct(age_group, age_start) |>
  arrange(age_start)
# A tibble: 7 × 2
age_group age_start
<chr> <int>
1 014 14
2 65 65
3 1524 1524
4 2534 2534
5 3544 3544
6 4554 4554
7 5564 5564Whitespace is the silent killer of joins and group-bys. Two rows that look identical can fail to match because one has a trailing space.
messy_names <- c("  Alice ", "Bob", " Charlie  ", "  Alice")

# str_trim removes leading/trailing whitespace
str_trim(messy_names)
[1] "Alice" "Bob" "Charlie" "Alice" # str_squish also collapses internal whitespace
str_squish(" too many spaces ")[1] "too many spaces"Always trim your strings before joining or grouping. This one habit will save you hours of debugging.
When you read a CSV, character columns sometimes get read as factors. This means levels() bakes in the exact set of unique values. If you then filter() down to a subset, the unused levels stick around as ghosts — inflating your legend in plots, adding empty groups in summaries, and generally causing confusion.
# Simulate the problem
species_factor <- factor(c("cat", "dog", "bird", "cat", "dog"))
filtered <- species_factor[species_factor != "bird"]

# "bird" is gone from the data but still in the levels
levels(filtered)
[1] "bird" "cat" "dog" # Fix: drop unused levels
levels(droplevels(filtered))[1] "cat" "dog"The lesson: use droplevels() after filtering factor data, or better yet, keep text as character columns with stringsAsFactors = FALSE (the default since R 4.0) and convert to factors only when you need explicit ordering.
Missing values propagate silently. Any arithmetic with NA returns NA. Any comparison with NA returns NA. This means filter(x == NA) never returns rows — use is.na() instead.
# This returns nothing — NA == NA is NA, not TRUE
starwars |>
  filter(mass == NA) |>
  nrow()
[1] 0# This is what you actually want
starwars |>
filter(is.na(mass)) |>
select(name, mass) |>
head()# A tibble: 6 × 2
name mass
<chr> <dbl>
1 Wilhuff Tarkin NA
2 Mon Mothma NA
3 Arvel Crynyd NA
4 Finis Valorum NA
5 Rugor Nass NA
6 Ric Olié NAFor summaries, always pass na.rm = TRUE.
# Without na.rm — returns NA
starwars |>
  summarize(avg_height = mean(height))
# A tibble: 1 × 1
avg_height
<dbl>
1 NA# With na.rm — returns the actual mean
starwars |>
summarize(avg_height = mean(height, na.rm = TRUE))# A tibble: 1 × 1
avg_height
<dbl>
1 175.If you want to replace NAs with a default value, use replace_na() from tidyr.
starwars |>
  mutate(hair_color = replace_na(hair_color, "unknown")) |>
  count(hair_color, sort = TRUE) |>
  head()
# A tibble: 6 × 2
hair_color n
<chr> <int>
1 none 38
2 brown 18
3 black 13
4 unknown 5
5 white 4
6 blond 3Before any analysis, always check for duplicates. distinct() keeps unique rows, and get_dupes() from the janitor package can identify which rows are repeated. Here’s the tidyverse approach:
who_tidy |>
  group_by(country, year, diagnosis, sex, age_group) |>
  filter(n() > 1) |>
  nrow()
[1] 0Zero duplicates — good. When you do find them, decide whether to keep the first, last, or aggregate.
Let’s chain everything into a real pipeline. Starting from the raw who2 data, we’ll clean, reshape, and summarize in one shot.
who2 |>
  # Reshape: wide to long, splitting column names
  pivot_longer(
    cols = !c(country, year),
    names_to = c("diagnosis", "sex", "age_group"),
    names_sep = "_",
    values_to = "count",
    values_drop_na = TRUE
  ) |>
  # Clean: standardize sex labels
  mutate(
    sex = str_replace_all(sex, c("m" = "male", "f" = "female")),
    age_start = str_extract(age_group, "^\\d+") |> as.integer()
  ) |>
  # Filter: focus on recent data
  filter(year >= 2010) |>
  # Summarize: total cases by country and sex
  group_by(country, sex) |>
  summarize(total_cases = sum(count), .groups = "drop") |>
  # Reshape: make a comparison table
  pivot_wider(names_from = sex, values_from = total_cases) |>
  # Sort: highest total burden first
  mutate(total = male + female) |>
  arrange(desc(total)) |>
  head(10)
# A tibble: 10 × 4
country female male total
<chr> <dbl> <dbl> <dbl>
1 China 1059090 2381098 3440188
2 India 585702 1316362 1902064
3 South Africa 593847 669632 1263479
4 Indonesia 530997 727340 1258337
5 Bangladesh 243335 399146 642481
6 Pakistan 206403 206493 412896
7 Russian Federation 121867 273245 395112
8 Philippines 111062 262920 373982
9 Democratic People's Republic of Korea 130943 211636 342579
10 Kenya 137336 188480 325816That’s eight operations piped together, and every step reads like a sentence. This kind of pipeline is what your daily R work will actually look like.
| Function | Package | What it does |
|---|---|---|
pivot_longer() |
tidyr | Reshape wide data to long format |
pivot_wider() |
tidyr | Reshape long data to wide format |
separate_wider_delim() |
tidyr | Split one column into many by delimiter |
unite() |
tidyr | Combine multiple columns into one |
replace_na() |
tidyr | Replace NA with a specified value |
str_detect() |
stringr | Test if a pattern exists in a string |
str_replace() |
stringr | Replace first match of a pattern |
str_replace_all() |
stringr | Replace all matches of a pattern |
str_extract() |
stringr | Pull out the first match of a pattern |
str_trim() |
stringr | Remove leading/trailing whitespace |
str_squish() |
stringr | Trim + collapse internal whitespace |
This is the unglamorous core of data analysis — the cleaning that happens before any chart or model. Master these tools and you’ll spend less time fighting your data and more time learning from it.